METATRADER 5 · FEATURE GUIDE
Two timeframes. One chart. Meet Denoxium PIP.
You are working on your main chart and want to check another timeframe. With Denoxium Picture-in-Picture, you can keep that second view on the same screen. Your main chart stays in place while a compact mini chart shows the same instrument on its own timeframe.
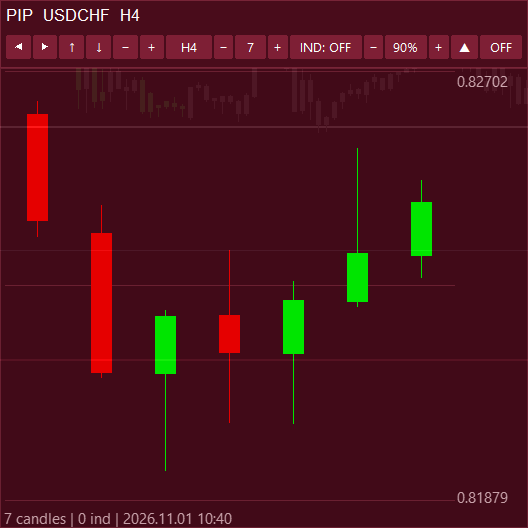
Keep your working view in place
Switching a chart from one timeframe to another changes the view you are reading. PIP gives you another way to compare periods: leave the main chart where it is and open a separate timeframe inside it.
For example, you could keep an M15 chart as your main workspace and choose H4 inside PIP. Both views show the same instrument. Changing the PIP period leaves the main chart's timeframe, orders and indicators unchanged.
That makes PIP useful whenever you want a quick look at another period while keeping your current workspace visible. You choose which timeframe belongs in the mini view.
Open PIP and choose a timeframe
On a normal Denoxium chart, click PIP in the lower action row, next to PICTURE and REC. The timeframe selector opens above the button. Choose the period you want to view; H4 is initially highlighted in the selector.
PIP opens as a square panel on the left. Its initial view contains the latest 7 candles, indicators off and 90% opacity. Rising candles are green and falling candles are red across themes.
The mini chart starts closed when Denoxium starts. Open it when you need the additional view, then close it with OFF when you are finished.
Choose candles alone or supported indicators
Prefer a clean candle view? Leave IND OFF selected. To bring supported indicators into the mini view, switch to IND ON.
PIP uses supported main-chart indicator parameters on the timeframe you select inside the mini chart. Main-chart indicators stay in place. Support depends on the indicator: arbitrary third-party indicators are not all reproduced, and an unsupported indicator may be skipped.
The choice belongs to the mini view, so you can keep the amount of detail appropriate to the comparison you are making.
Fit the view to your workspace
The header and candle area form one panel, with controls arranged in a single row. Use the arrows to move it, adjust its size and choose how many candles to display.
The candle count can be set from 2 to 200. Opacity runs from 0% to 100% in ten-percentage-point steps. Higher opacity covers more of the chart beneath; lower opacity lets more of the underlying chart show through.
You can also collapse the candle area while keeping the header available. On normal charts, saved personal settings can replace the initial defaults. One PIP view can be open per terminal at a time; close the current view with OFF before opening it from another chart.
Use the same idea in Visual Strategy Tester
PIP is also available in Denoxium's visual Strategy Tester interface. Look for it in the upper row: PIP, Denoxium Levels, SESSION, SMC.
The mini view follows simulated test time and has its own timeframe. Changing it leaves the main test chart's period unchanged. Tester PIP settings are separate from saved normal-chart PIP settings, so practising with a different view does not overwrite your regular layout.
Add another timeframe to your view
PIP brings a second timeframe into the workspace you already use. Open the view, choose a period and decide how much detail you want to see.
Explore Denoxium for MetaTrader 5 at denoxium.com.
Denoxium is a manual trade-management and practice tool. Trading involves risk.